pingouin.rm_corr#
- pingouin.rm_corr(data=None, x=None, y=None, subject=None)[source]#
Repeated measures correlation.
- Parameters:
- data
pandas.DataFrame Dataframe.
- x, ystring
Name of columns in
datacontaining the two dependent variables.- subjectstring
Name of column in
datacontaining the subject indicator.
- data
- Returns:
- stats
pandas.DataFrame 'r': Repeated measures correlation coefficient'dof': Degrees of freedom'pval': p-value'CI95': 95% parametric confidence intervals'power': achieved power of the test (= 1 - type II error).
- stats
See also
Notes
Repeated measures correlation (rmcorr) is a statistical technique for determining the common within-individual association for paired measures assessed on two or more occasions for multiple individuals.
From Bakdash and Marusich (2017):
Rmcorr accounts for non-independence among observations using analysis of covariance (ANCOVA) to statistically adjust for inter-individual variability. By removing measured variance between-participants, rmcorr provides the best linear fit for each participant using parallel regression lines (the same slope) with varying intercepts. Like a Pearson correlation coefficient, the rmcorr coefficient is bounded by − 1 to 1 and represents the strength of the linear association between two variables.
Results have been tested against the rmcorr R package.
Missing values are automatically removed from the dataframe (listwise deletion).
Examples
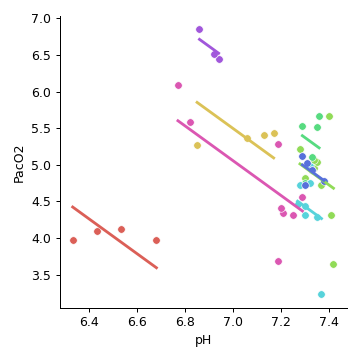
>>> import pingouin as pg
>>> df = pg.read_dataset("rm_corr")
>>> pg.rm_corr(data=df, x="pH", y="PacO2", subject="Subject")
               r  dof      pval            CI95     power
rm_corr -0.50677   38  0.000847  [-0.71, -0.23]  0.929579
Now plot using the
pingouin.plot_rm_corr()function:>>> import pingouin as pg >>> df = pg.read_dataset("rm_corr") >>> g = pg.plot_rm_corr(data=df, x="pH", y="PacO2", subject="Subject")